loveholidays
Travel & Tourism, Artificial Intelligence


2025
London, UK
Internal Multi-Agent AI Data Platform
A design-led, production-ready AI platform that democratised data, accelerated discovery, and helped us move from reactive reporting to proactive, AI-powered decision-making.
A design-led, production-ready internal AI platform that made customer and business data explorable through natural-language conversation. Built for eight departments at loveholidays, it reduced analysis from weeks to seconds, cut manual analysis effort by more than two-thirds, and supported a shift from reactive reporting to proactive decision-making.

- 70%+Manual analysis time reductionReduced the time required for manual analysis during the internal beta.
- 8+ departmentsDepartments engaged with exploratory dataEnabled exploratory customer and business data engagement across multiple departments during the beta.
Context
"What are travellers frustrated about this week? And what are they starting to care about that we're not even measuring yet?" At loveholidays, answering a question like that once demanded weeks of manual analysis; now it takes seconds.
This was an internal, experimental yet production-ready AI platform that made the company's own customer and business data explorable by everyone across eight departments, not just analysts or engineers. It cut manual analysis time by more than two-thirds and turned insight from something you 'pull' on request into something you continuously explore. It is a separate system from Sandy, loveholidays' customer-facing virtual assistant (2020, built on Dialogflow and Contact Center AI); what this case study covers is the internal data-democratisation and Voice-of-Customer exploration layer built alongside it.
I led and implemented it as AI Product Design Lead, through a design-led, full-stack execution driven primarily by a single AI Product Designer rather than a large traditional engineering squad. My role covered the end-to-end lifecycle: research and opportunity framing, information architecture and data abstraction, multi-agent orchestration and prompt architecture, back-end integration with internal data sources, and the front-end experience for conversational exploration. The work was experimental in scope but production-ready in governance, resilience and observability.
It ran from 2022 to November 2025: from the January 2023 manifesto 'The Big Picture', through UX foundations and a 2024 rebuild on governed enterprise foundations, to a 31 March 2025 internal beta that changed how department leads worked. By November 2025 the platform had completed its mission as a standalone product; its patterns, components and learnings now underpin a company-wide AI scale-up led by a cross-functional 'AI Task Force'.

Challenge
It was a cold January morning in 2023 when I opened a blank document titled 'The Big Picture'. loveholidays' internal tools were built for static reporting, snapshots, exports and presentations that were good at answering predefined questions and terrible at helping the business discover new ones. Travellers don't wake up thinking in the categories our dashboards were built around; they think in feelings and constraints, in 'a warm beach with water sports where I can actually unwind with my family' rather than 'Destination X with Budget Y'. Stakeholders praised the research artefacts we produced, then asked for a slightly different cut of the same information the following week. Another diagram was never going to fix that: what the business needed was a living, conversational layer where people could explore the journey directly instead of waiting for the next deck.
Proven at the customer edge, missing on the inside
loveholidays had already established itself as an AI trailblazer. Sandy, the virtual assistant built on Dialogflow and Contact Center AI in 2020, resolves a significant share of support contacts: Google Cloud's February 2024 case study cites around 50% self-service and multi-million-pound savings. Press coverage (Irish News, Diginomica) credited AI-driven localisation with accelerating the company's German launch in 2023, and loveholidays' Director of Business IT & Conversational AI, Eugene Neale, has shared Sandy's results at multiple European conferences. Those successes proved loveholidays could use AI to optimise operations and scale customer support. The missing piece was an internal layer that made our own data explorable by everyone, not just analysts or engineers: the chance to move from reacting to market demand to shaping it.
The narrower, harder problem
On top of those operational AI successes, the Product Design & Research (UXD&R) team set out to solve something sharper. Customer feedback was scattered across survey programmes, review platforms, service interactions and social listening signals, and none of it was explorable. The goal was not just to centralise that feedback, but to let any colleague move from 'Show me the NPS trend for last quarter' to 'Help me discover what's emerging in German mobile behaviour for young families this week': a system that encourages curiosity, helps people probe weak signals, and lets the organisation spot opportunities before competitors even see them.
What success looked like
Success meant democratising access to trusted customer and business insight across eight departments, replacing static, siloed analysis with a living conversational knowledge base, segmented in enough detail (by journey phase, traveller type and market) that no signal got lost in aggregation. The platform was built to invite exploration rather than only deliver numbers, with prompts and flows shaped around 'What if…?', 'Show me what's changing…' and 'What's unusual this week compared to last month?' rather than only 'Give me the number for Q4.' The headline test was simple: make it trivial to ask 'What are this quarter's top booking concern, and what's starting to move that we should watch now?' and get a meaningful answer in seconds, with every touchpoint of the journey addressed, from Dreaming through Planning, Booking, Post-Booking, On-Holiday and Post-Travel, so no stage sat outside what the platform could explain.
Approach
From 2022 into 2023, I practised the classic UX repertoire: end-to-end journey maps, personas, pain-point grids and service blueprints. By September 2023 I owned a beautifully documented booking journey, Dreaming, Planning, Booking, Experiencing and Sharing, that was still completely static. Knowledge piled up; accessibility to it did not. So in early 2024 we rebuilt the experience on hardened enterprise foundations so teams could safely talk to their data, and the most important decision was philosophical: design for exploration first, answers second.
How I tested it
Research combined ethnographic work with department heads and continuous testing of exploratory workflows, led by a Senior UX Researcher who anchored user discovery and evaluated how the platform changed decision-making behaviour, not just task completion. Behind the journey maps sat a behavioural scoring system that captured intent and friction at every interaction, first-activity and task interactions, 5-second engagement and drop-off, feeding the engagement and friction metrics we used to prioritise where the exploration experience needed the most work. Analysts and department leads tested live natural-language queries during the January 2024 prototype and the March 2025 beta, with frequent demos and live exploration sessions built into the process.
What we built
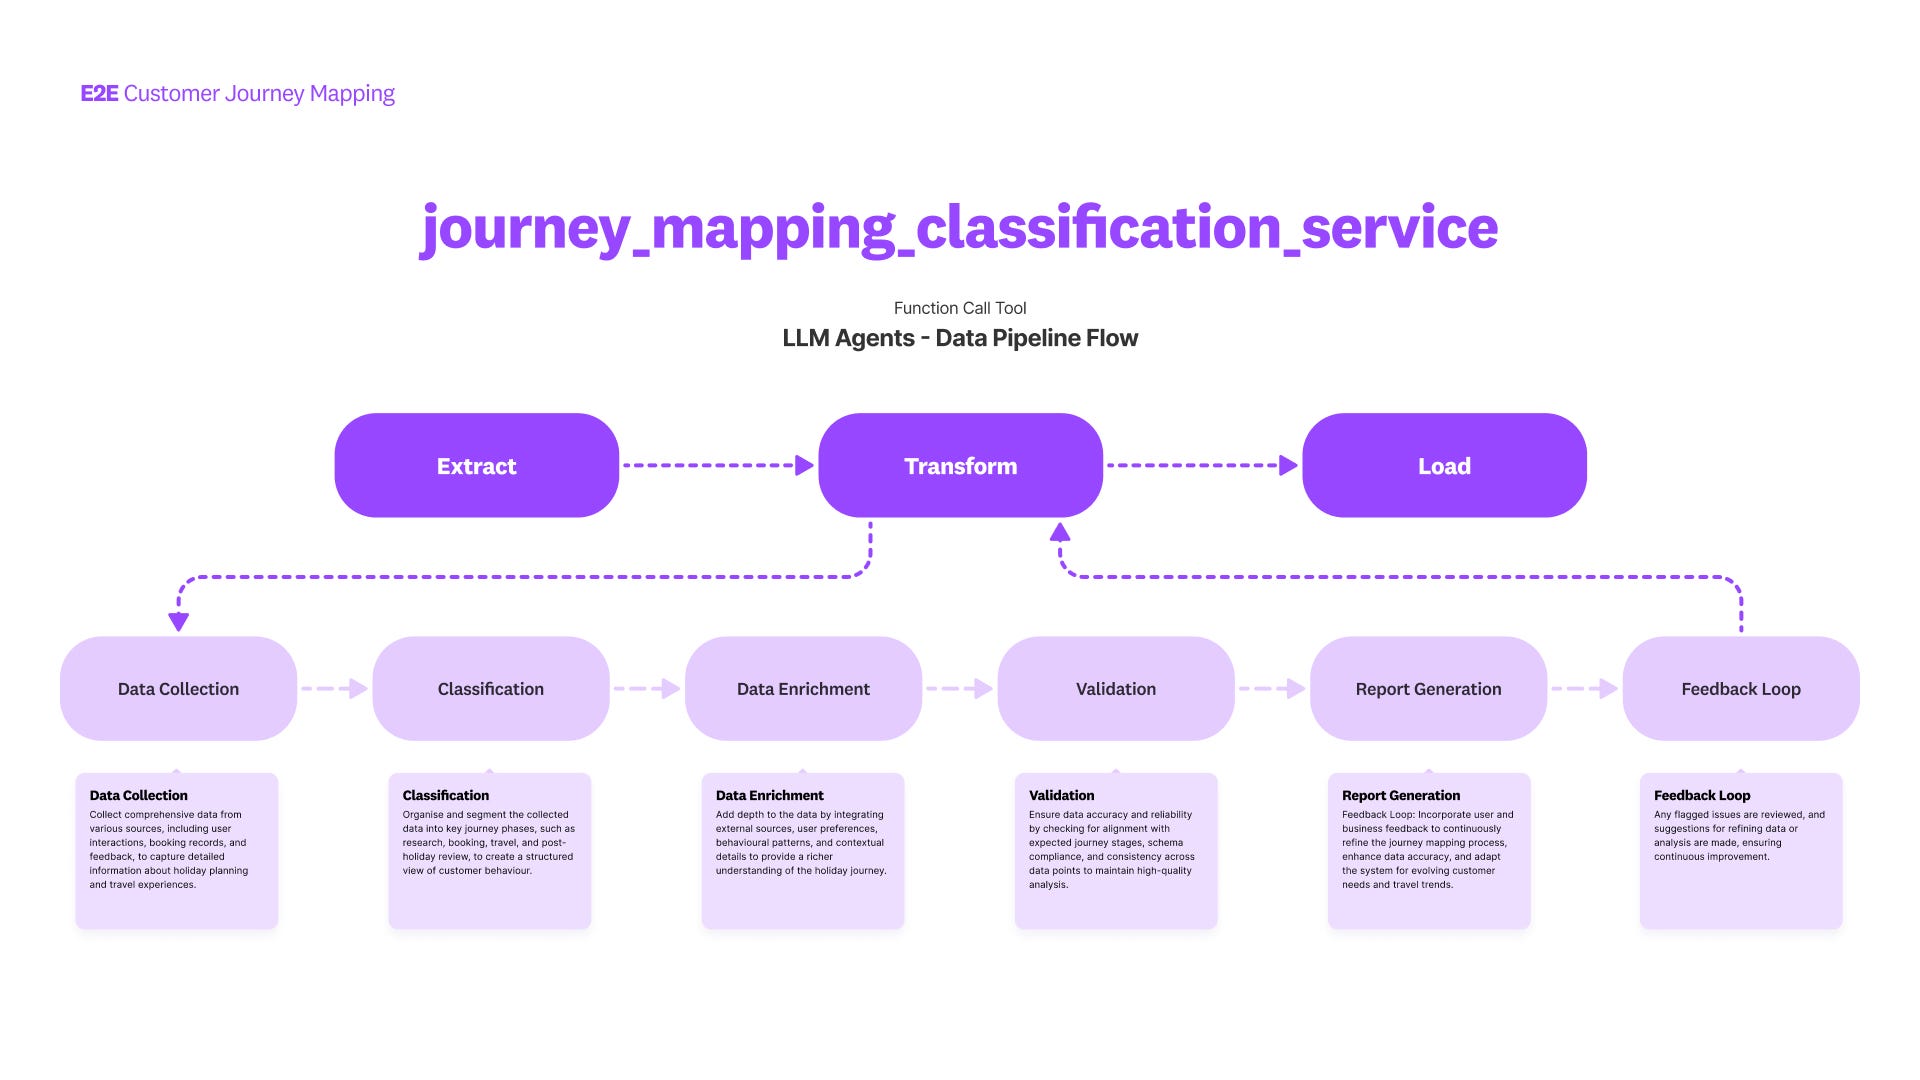
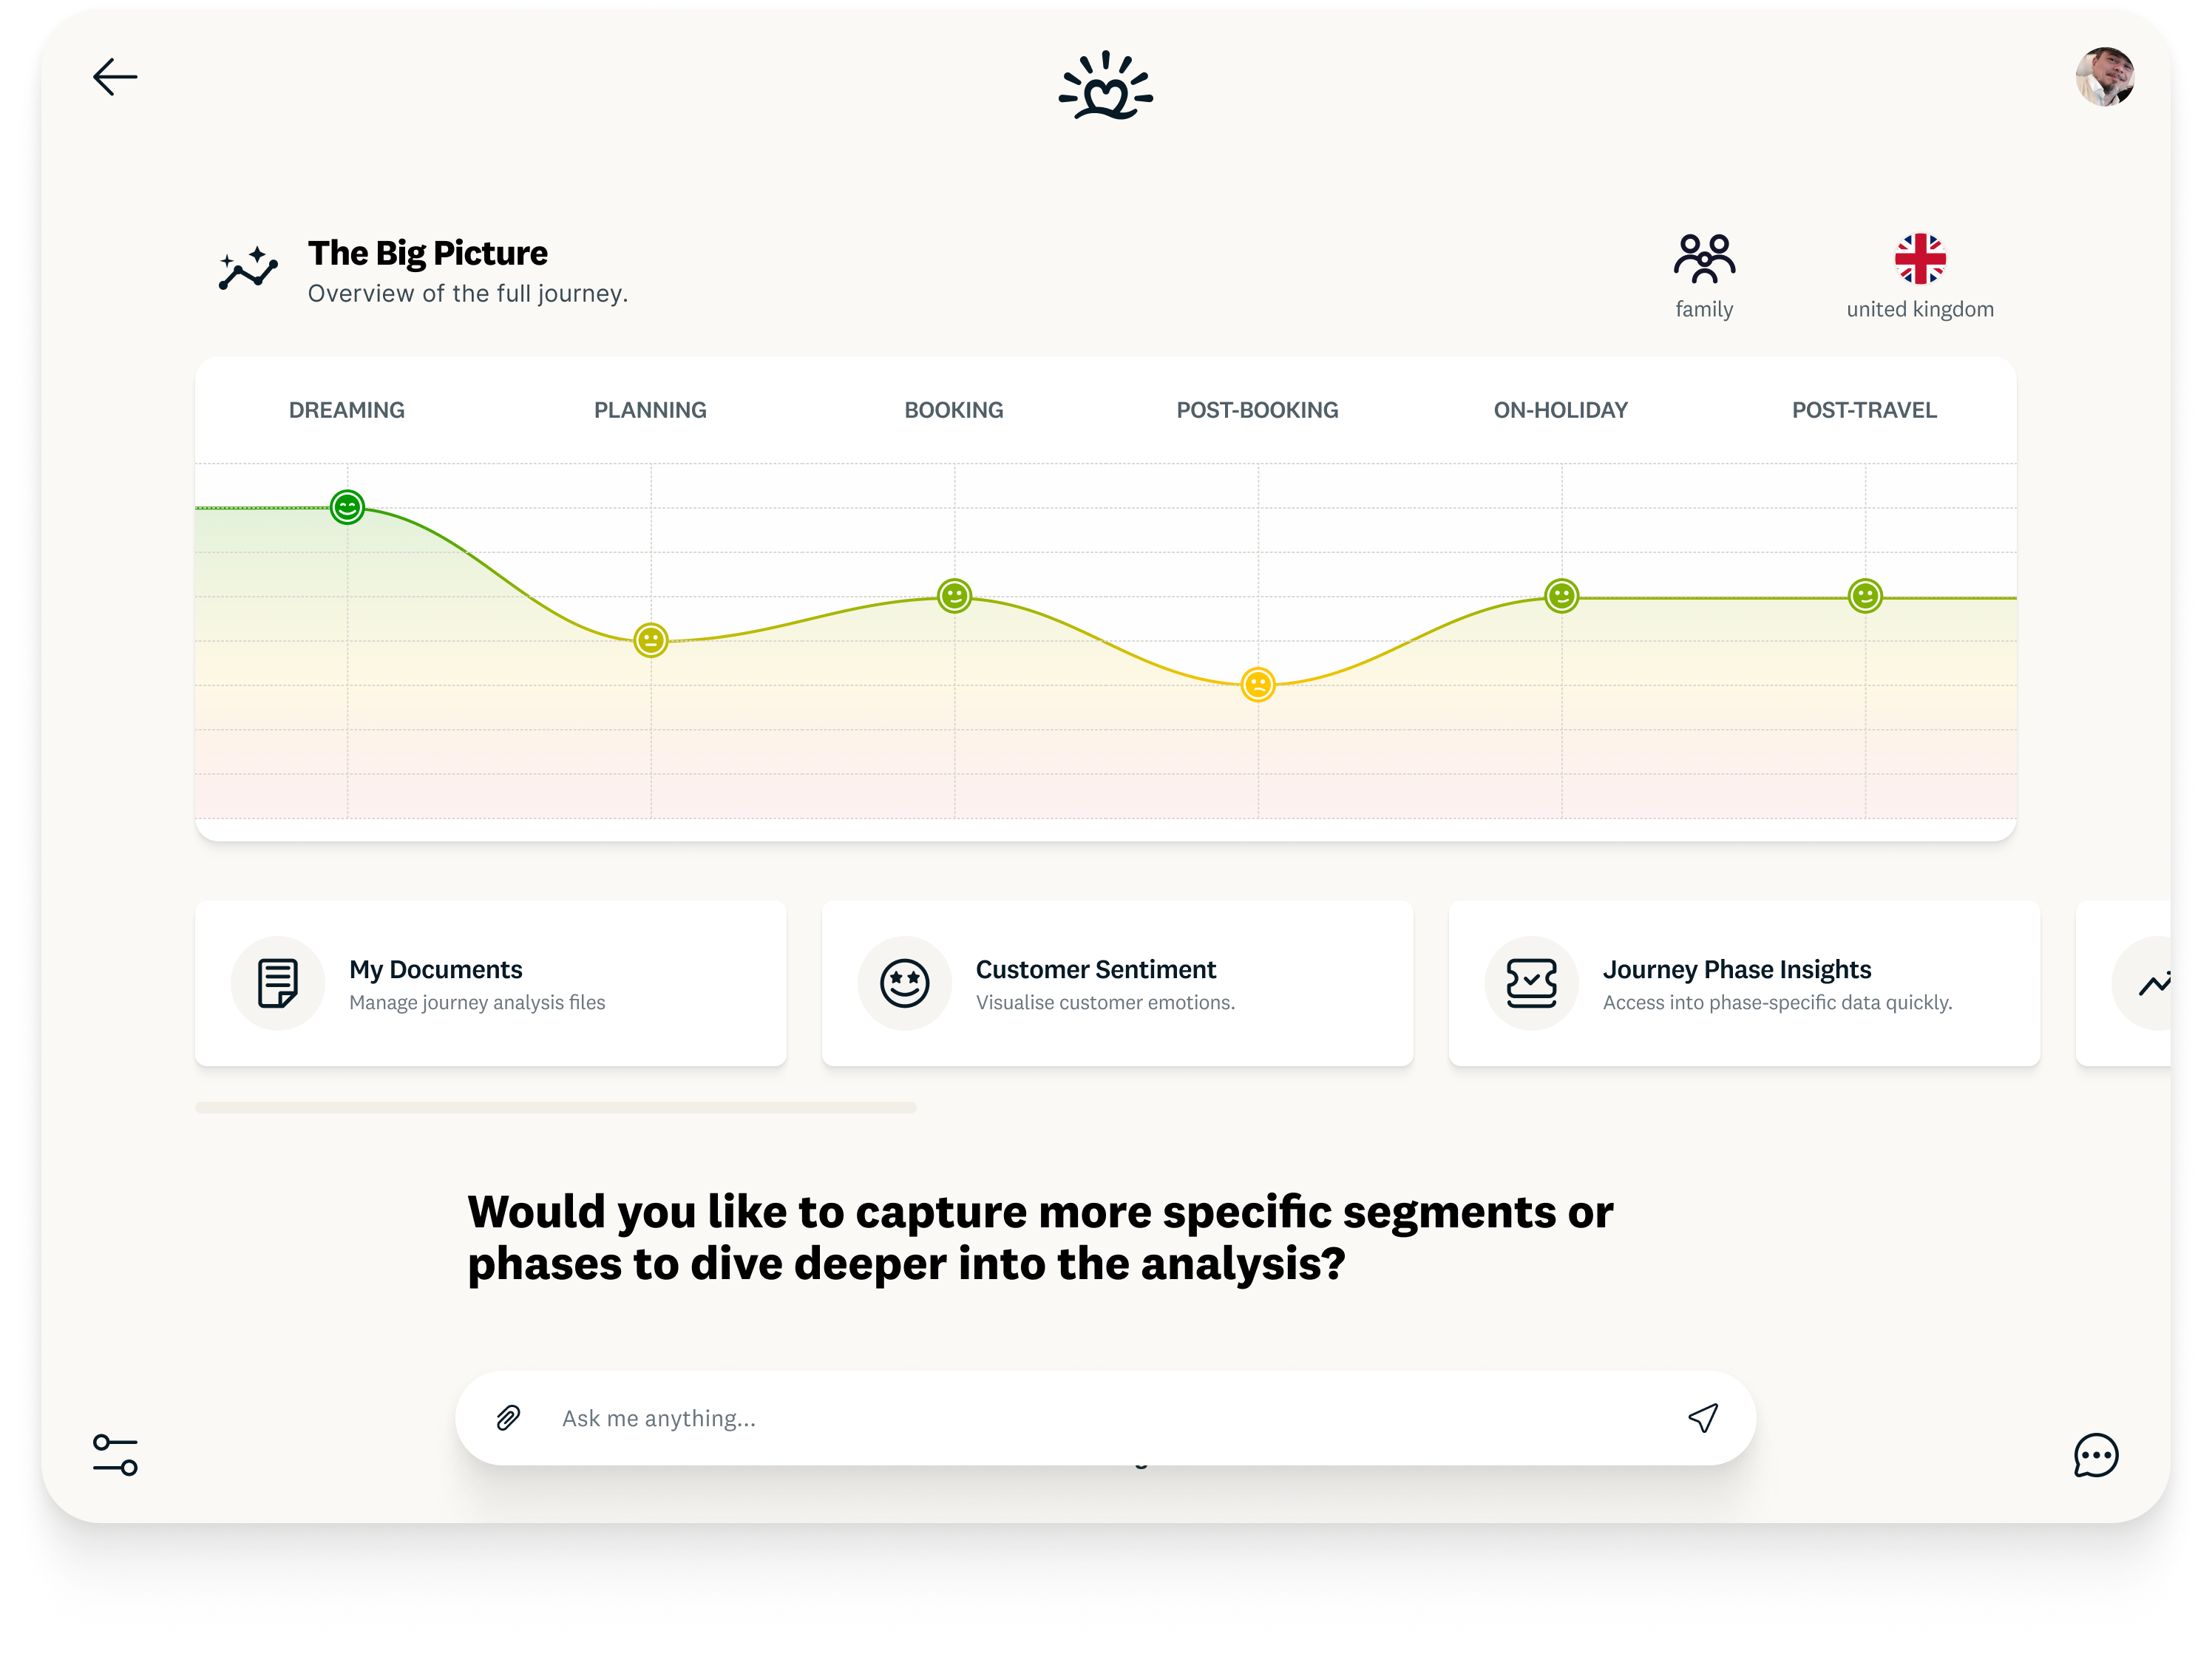
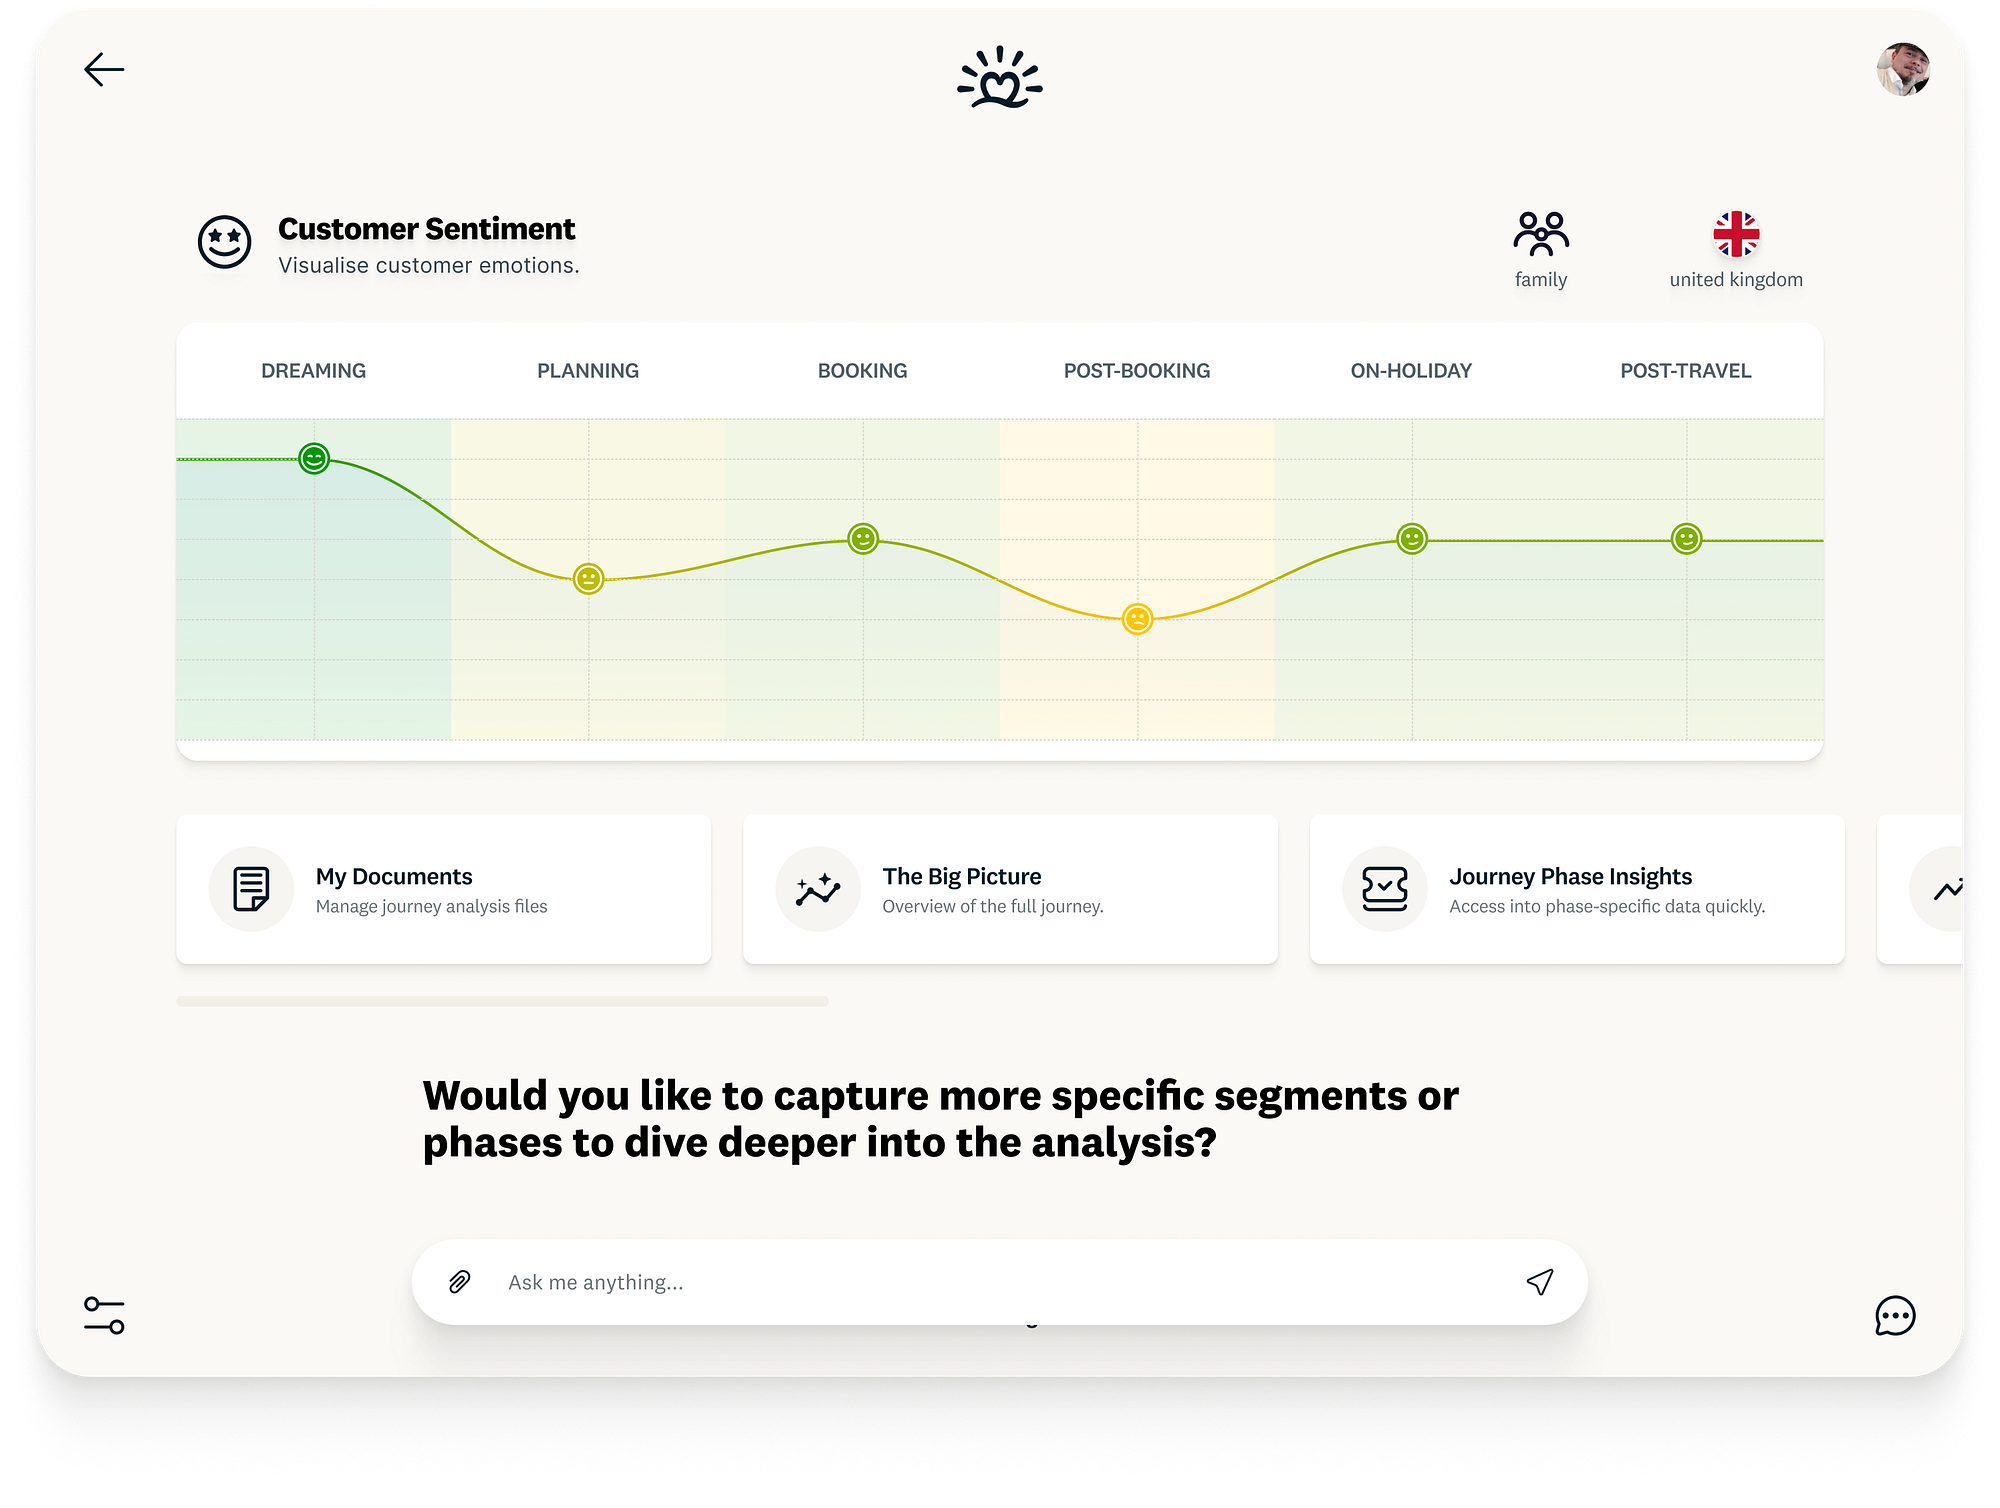
The solution combined a conversational exploration interface with an AI-powered Voice of Customer (VoC) system. The VoC layer collects and centralises structured data (bookings, surveys, behavioural metrics) and unstructured data (reviews, emails, support transcripts, social comments), normalising all of it into a unified, AI-ready representation of the customer journey. LLM-based agents then analyse and classify it: scoring sentiment, tagging journey phase (Dreaming through Post-Holiday), tagging traveller segment (Family, Couple, Solo and others) and market (UK, DE, IE and others), and detecting emerging topics and recurring themes. Employees ask questions in plain language, 'What's driving low CSAT for UK families while they're on holiday?' or 'What new issues are emerging for mobile bookers in Germany this week?', and the system responds with data-backed narratives, charts and a suggested follow-up question, nudging people to explore rather than stop at the first answer.
Decisions
A modular, multi-agent architecture
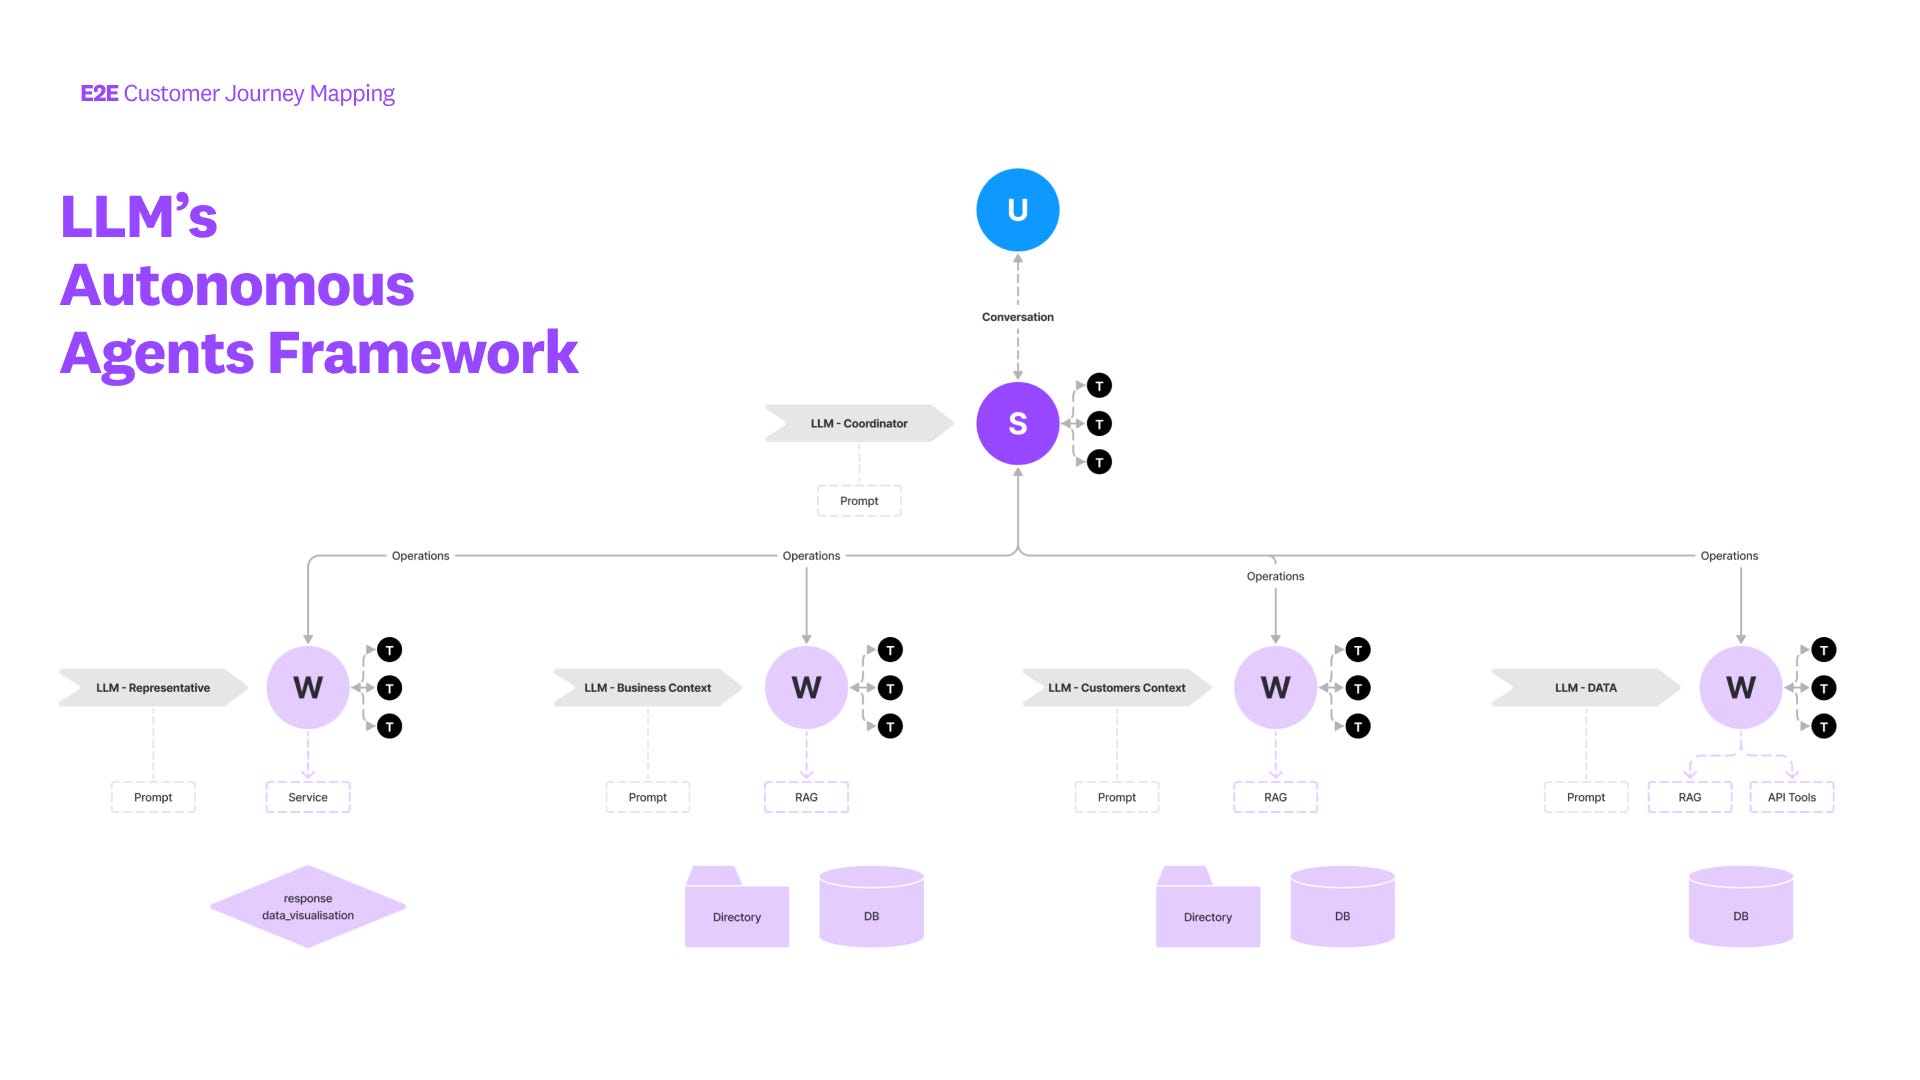
To support open-ended exploration we built a modular, multi-agent architecture: a coordinating layer routes natural-language requests to specialised agents, then recomposes a single human-readable response. The information architecture represents customer journeys, segments, markets and feedback signals through a semantic abstraction layer rather than exposing the underlying systems directly.
That was a deliberate choice. It meant new models, tools and data sources could be added later without disrupting the conversation pattern people had already learned.
Designing for curiosity, not single-shot queries
The interaction patterns were chosen to reward curiosity rather than one-off questions:
- natural language as the default interface, with no new tool to learn
- contextual responses that suggest the next question
- progressive disclosure that reveals detail only as needed
- consistent patterns, so people felt safe exploring the data
Making generated answers inspectable
We treated trust as part of the product architecture rather than as a final interface treatment. Structured-output contracts constrained agent responses, retry loops corrected recoverable failures, and generated SQL was surfaced so users could independently reconcile an answer with the underlying query. That made the system's reasoning path visible and gave teams a practical way to challenge, verify and reuse generated insight.
Results
The research settled one thing first: loveholidays did not need another static diagram or dashboard variant. It needed a living layer for asking different questions directly of the customer journey. The completed service blueprint became the reference model the agents were built to reason over.
What changed in the beta
During the March 2025 internal beta, department leads watched live queries resolve in real time. Teams moved from requesting reports to exploring questions directly, and colleagues who had never used a business intelligence tool could engage with complex data through plain-language prompts and guided exploration.
What the beta measured
The internal beta assessment reported three directional outcomes:
- 70%+ reduction in manual analysis time during the internal beta.
- Under 5 minutes to reach an insight, compared with 4 to 6 hours previously.
- 8+ departments engaged with exploratory customer and business data during the beta.
These figures are directional, based on an internal beta assessment and covered by a non-disclosure agreement. They are evidence of operational effect, not independently audited commercial metrics.
Reflection
A few lessons held across the whole programme. Start from how people actually make decisions, explore ideas and react to change: human behaviour first, not the model. Don't just speed up answers; design systems that encourage better questions. Quick GPT wrappers and scripts are useful experiments precisely because their limitations show where deeper, more robust design is needed. Agent-based systems scale gracefully when they're organised around real exploration flows, not arbitrary microservices. Frequent demos and live exploration sessions turned sceptics into champions faster than any deck. A lean team sharpened focus on the journeys and use cases that mattered most, and accessible, explorative insight beats analytic gatekeeping every time: it accelerates organisational learning instead of hoarding it.
Where it goes next
The internal exploration platform was never meant to stay inside the building. The 2026 concept takes the 'explore first, answer second' philosophy that worked for internal users and expresses it as 'vibe first, filters later' for travellers: an AI-powered Family discovery journey where the parent never starts with filters, they start with feelings, and the AI quietly does the filtering for them. A Families hub surfaces intent-based tiles, 'All inclusive beach resorts with kids activities', 'Kids pool', 'Outdoor adventures', 'Cultural experiences', where each tile is a pre-packaged AI query, not a static card. Behind every chip sits a set of semantic tags and VoC signals learned from the internal platform: the complaints about cold pools, the love for kids clubs, the stress about airports and room layout. A guided flow speaks human language first ('Let's start planning your perfect family holiday' → 'Great choice! Let's find a family-friendly destination' → 'Perfect! Let's narrow it down'), translating a job-to-be-done ('As a parent, I want to easily plan holidays that please the whole family so that everyone can have a memorable and enjoyable experience') into story-driven bundles with prices, images and tags that already make sense to a tired parent. Families are the first micro case study; couples, solo travellers and special-interest segments follow next.
Prototype: InsightBites
The first conversational prototype reached a small analyst cohort in January 2024.
A year later, in January 2025, the ‘InsightBites’ proof of concept surfaced several high-value opportunities in weeks rather than quarters:
- on-trip experience signals pointed at frustration around support access and late operational changes
- value patterns by traveller type showed family bookings carrying materially higher average value while couple travel drove volume
- mobile friction among younger travellers indicated untapped conversion headroom
- and attachment barriers around extras traced back to pricing clarity and confidence
Each finding emerged through continuous conversational exploration, often weeks before it would have surfaced in a traditional dashboard: dramatically reducing manual analysis effort and producing a unified, trusted, explorable view of customer feedback.
Tools & Skills
Opportunity framing, stakeholder interviews and the 'Big Picture' manifesto that reframed data as something to explore, not report on.
End-to-end journey maps, personas, pain-point grids and service blueprints built through the classic 2022-2023 UX repertoire.
Shaping how journeys, segments and markets are represented so non-analysts could query them safely.
Designing the coordinator/specialist-agent pattern and the prompts that route natural-language requests between them.
Back-end integration with internal data sources, orchestration services, and the front-end conversational experience.
New testing methods focused on discovery (did the platform change how people decided) rather than task completion alone.
Coaching other designers on AI interface and exploration patterns, moving them from designing screens to designing systems.
Tech Stack & Architecture
Orchestrates the dialogue and maintains the exploration context across a conversation.
Executes complex analytics and comparisons behind each natural-language question.
Load-balances tasks and manages long-running jobs so exploration stays responsive.
Preserves a user's history, preferences and previous queries between sessions.
Connects the coordinator to diverse data stores across the organisation.
An Extract, Transform, Load service: Data Collection, Classification, Data Enrichment, Validation, Report Generation, Feedback Loop: that turns raw customer signals into the segmented, journey-tagged data the agents reason over.
Governed access and permissions, semantic abstraction and domain-centred data models, scalable processing pipelines, and observable, controllable query execution, rebuilt in early 2024 so teams could safely talk to their data.
Accessibility & Inclusive Use
To ensure the platform worked for different roles and working styles, we supported multi-modal input options for different preferences, used progressive disclosure so occasional users weren’t overwhelmed by everything at once, kept conversational patterns consistent across data types, and gave clear error and recovery paths that encouraged people to keep exploring rather than abandon the session.
Drilling from the full journey into a single phase (Post-Booking, then Confirmation, Manage and Pre-departure) without losing the surrounding context is what let colleagues who’d never touched a BI tool follow a thread of curiosity to a specific, actionable answer.
Experimentation & Rollout
Designing for exploration meant reliability couldn’t be an afterthought. We added a resilience layer that retried stalled requests, gracefully handled upstream timeouts, surfaced partial answers with clear explanations, and suggested alternative paths when something failed: keeping explorations feeling smooth even while the underlying services and models kept evolving.
The platform reached a small analyst cohort in January 2024, its multi-agent architecture in May 2024, was pulled back from a ‘quick GPT wrapper’ toward a more robust, secure build in September 2024, and rolled out to department leads in a 31 March 2025 internal beta. It was built to segment and classify across six European markets (GB, IE, DE, NL, AT, PL) with, in the platform’s own words, ‘the ability to seamlessly scale to future markets.’
Disclaimers
This case study demonstrates advanced AI interface design while protecting proprietary business information, focusing on design process, user experience outcomes and industry innovation rather than sensitive commercial metrics.
Fair dealing: shared under Sections 29 and 30 of the Copyright, Designs and Patents Act 1988, written for research, criticism, review and design-methodology-sharing purposes.
Key facts
- Client
- loveholidays
- Year
- 2025
- Role
- AI Product Design Lead
- Industry
- Travel & Tourism, Artificial Intelligence
- Location
- London, UK
- Manual analysis time reduction
- 70%+
- Departments engaged with exploratory data
- 8+ departments
What was the challenge in Internal Multi-Agent AI Data Platform?
It was a cold January morning in 2023 when I opened a blank document titled 'The Big Picture'. loveholidays' internal tools were built for static reporting, snapshots, exports and presentations that were good at answering predefined questions and terrible at helping the business discover new ones.
What did I actually do on Internal Multi-Agent AI Data Platform?
From 2022 into 2023, I practised the classic UX repertoire: end-to-end journey maps, personas, pain-point grids and service blueprints. By September 2023 I owned a beautifully documented booking journey, Dreaming, Planning, Booking, Experiencing and Sharing, that was still completely static. Knowledge piled up; accessibility to it did not.
What was the outcome of Internal Multi-Agent AI Data Platform?
The research settled one thing first: loveholidays did not need another static diagram or dashboard variant. It needed a living layer for asking different questions directly of the customer journey. The completed service blueprint became the reference model the agents were built to reason over. Measured outcomes: Manual analysis time reduction: 70%+; Departments engaged with exploratory data: 8+ departments.